
Normal Distribution Part 1 Quiz
Normal Distribution Part 1 Quiz introduces the famous bell curve through a story that quietly shaped modern statistics. In the nineteenth century, Belgian statistician Adolphe Quetelet noticed that many human measurements clustered neatly around an average, with fewer extreme values appearing at the edges. This observation later helped popularize the bell curve as a way to describe natural variation. Over time, researchers realized that many datasets follow this smooth pattern, where most values gather near the center and thin tails stretch outward. The idea became so influential that it inspired rules to summarize how data spreads around the middle. Concepts like the empirical rule emerged to explain why numbers behave so predictably in this curve. This quiz explores how such patterns help make sense of large collections of values.

Report a question

Sample Questions from This Quiz
- What is the shape of a normal distribution curve?
- In a normal distribution, what are the mean, median, and mode?
- How many tails does a normal distribution have?
- What is the total area under a normal distribution curve?
- In a normal distribution, where do most data points lie?
Beyond Normal Distribution Part 1 Quiz

Normal Distribution 2
Even extremes get their place in the gentle curve!

Percentile Part 1
Not top, not bottom, just perfectly placed in the list!

Percentile Part 2
Order reveals truths numbers prefer to hide!
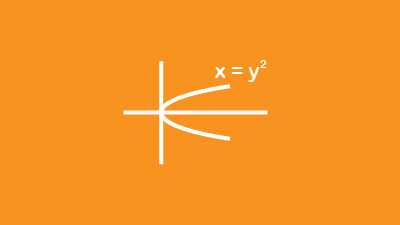
Parabola Part 3
Tame tricky graphs before they start acting like drama queens!

Parabola Part 4
Curves that never lie but might quietly judge your skills!
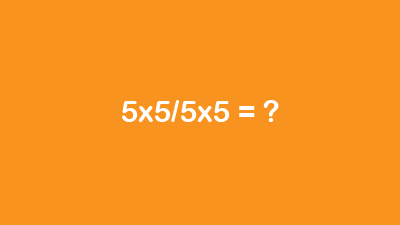
PEMDAS Part 1
Multiply your fun before dividing your focus, math says so!
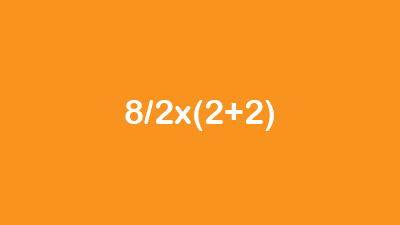
PEMDAS Part 2
Calm your numbers, order will restore peace in the equation!

Cyclic Patterns Part 1
Days, digits, and letters secretly enjoy living life in circles!