
Percentile Part 1 Quiz
Percentile Part 1 Quiz introduces percentiles in statistics through a familiar exam room story. Years ago, a national level test reported only percentile scores instead of marks, leaving many candidates puzzled at first. A student who expected a high rank was surprised to see friends with lower marks placed nearby. The explanation lay in relative position rather than absolute numbers. That single change reshaped how results were understood across the country. Percentiles quietly became a fairer way to compare performance across large groups. This idea connects naturally with how datasets are arranged and interpreted, alongside concepts often discussed with mean, median and mode. The quiz builds intuition around this ranking logic using everyday reasoning, helping readers grasp what does the 50th percentile represent in a dataset without relying on formulas.

Report a question

Sample Questions from This Quiz
- What does the 50th percentile represent in a dataset?
- What information does a percentile give?
- In an ordered dataset, what does the 25th percentile represent?
- Which of the following best describes percentile rank?
- If a test score is at the 75th percentile, how many students scored lower?
Beyond Percentile Part 1 Quiz

Percentile Part 2
Order reveals truths numbers prefer to hide!
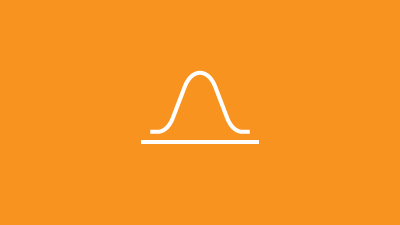
Normal Distribution 1
Tame tricky graphs before they start acting like drama queens!

Normal Distribution 2
Even extremes get their place in the gentle curve!

Parabola Part 1
Test your curve skills before they curve away from you!

Parabola Part 2
See if your maths memory still knows its favourite curve!

Parabola Part 3
Tame tricky graphs before they start acting like drama queens!

Parabola Part 4
Curves that never lie but might quietly judge your skills!
PEMDAS Part 1
Multiply your fun before dividing your focus, math says so!